


The headlines are everywhere: the real estate market is slowing and slowing fast. But just how bad is it, really? To get a better understanding of the current state of the market, we looked at it by the numbers and from a historical context. The data in this report includes contracts signed (the best real-time gauge of market performance) in June, July, and August (the typical ‘summer season’ full months between Memorial Day and Labor Day) from 2010-2022. Comparisons were drawn both year-over-year and from the average number of deals from 2010-2019, the pre-covid market.
Manhattan
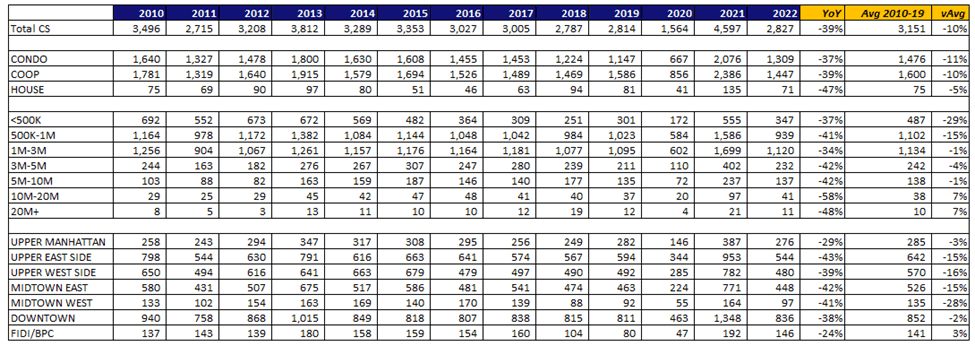
In Manhattan, there were 2,827 contracts signed over the summer months, down a staggering 39% from this time last year. While the decline was of little surprise given how robust the market was last year, a deeper dive showed additional concerns. While running below last years figures, the current figure is also 10% less than the average number of deals signed in the pre-covid summers from 2010-2019. The figures run consistent for both condos and coops, with neither property class performing better than the other. Still, current figures are higher than both 2018 and 2019, the most recent pre-covid years.
Compared to 2021, the decline in deals was evident across all price points and submarkets. The greatest percentage drop in transactions was for those priced between $10-20 million, down 58% year-over-year. By area, the Upper East Side saw the greatest pullback, with deals down 43%. Midtown East closely followed, down 42% and Midtown West was down 41%. Lower Manhattan, encompassing the Financial District and Battery Park City, fared the best with the number of property trades down just 24%.
However, when we pull back the curtain and compare this summer to the pre-covid summer average, the results are telling. While overall deal activity is still running 10% less, it is heavily concentrated in the sub-$1 million market. This is undoubtedly due in large part to rising mortgage rates, which have the most outsized impact on lower price points. Trades under $500,000 are down 29% and trades between $500,000-1 million are down 15%.
The $10-20 million market and $20 million-plus markets are both running 7% higher than their pre-covid average. The $5-10 million bracket is running just 1% less, as is the $1-3 million bracket. Trades between $3-5 million are just 4% off their pre-covid figures.
By area, Lower Manhattan is the only submarket in the city outperforming its pre-covid average, up 3%. Just to the north, Downtown Manhattan is running 2% behind, and Upper Manhattan is 3% lower. Midtown West was the worst performing, with transactions down 28% from the areas pre-covid average. It was the only submarket with fewer than 100 contacts signed.
Manhattan Pricing + Days on Market
While the number of transactions is in decline, prices are not. The median price of a contracted home increased 1% from 2021 to $1,159,000. This is promising news for homeowners as we have yet to see any major correction in prices due to fewer sales, rising mortgage rates, and economic instability.
Additionally, Manhattan homes are selling in an average of 144 days, down 17% from last year. The number is also the lowest on record since 2017 when homes sold in an average of 131 days. Notably, the time it took properties to sell increased every year since 2014, peaking in 2020, and has been on a downward trajectory since.

Brooklyn
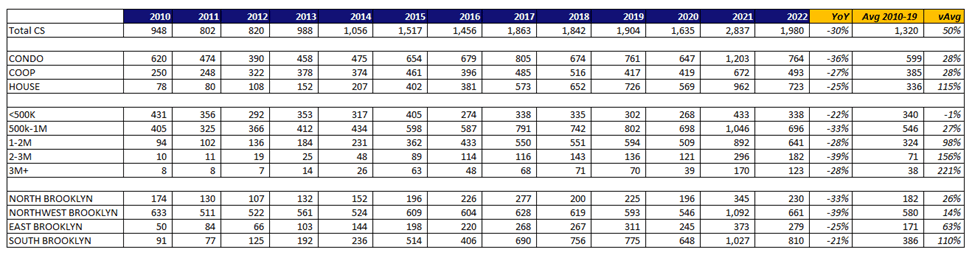
In Brooklyn, there were 1,980 contracts signed over the summer months, down 30% from this time last year. While the decline is pronounced, it was not as steep as the drop in Manhattan. Brooklyn’s mixed housing stock, consisting of far more townhomes relative to condos and coops, has resulted in strong demand not just during the pandemic but after as well. Notably, the number of summer season trades, while down from last year, was the highest total otherwise since 2010. In fact, the number of 2022 contracts signed are up 50% from the 2010-2019 pre-covid average.
By price point, the yearly decline was spread fairly evenly across price points and submarkets. However, when comparing to the pre-covid average, the picture becomes more mixed. Deals for properties priced under $500,000 were the only bracket to note a decline from the 10-year average. While this is due in part to rising mortgage rates, the decline is also a result of rapidly rising prices in the borough. There are simply fewer and fewer homes for sale under $500,000 with each passing year. Sales for homes priced between $500,000-1 million saw the smallest increase, up 27%.
However, like Manhattan, it was the costliest properties that noted the greatest increases over their 10-year pre-covid average. Contracts are up 98% for homes priced between $1-2 million, up 156% for those between $2-3 million, and up 221% for homes costing $3 million or more. The luxury sector of the market has outperformed at all levels, driven by increased demand which fueled price growth and luxury new development condos. The costly new development market has emerged over the last five years and is a relatively new phenomenon in Brooklyn.
By area, Northwest Brooklyn saw the greatest pullback in deal activity from last year. While this was not unexpected given how strong 2021 was, the decline can also be attributed to the lack of inventory in the submarket for all property types, especially brownstones, for which the area is known. When compared to the pre-covid average, South Brooklyn has seen the greatest level of growth, with contracts up 110%. East Brooklyn followed, up 63%, and North Brooklyn was up 26%.
The rapid price growth in North and Northwest Brooklyn has pushed more buyers deeper into the borough. East Brooklyn is emerging as a destination of choice for developers and individual homeowners alike, as has South Brooklyn. The pace of growth will likely continue in the coming years.
Brooklyn Pricing + Days on Market
Compared to last year, despite the 30% drop in new sales, pricing in Brooklyn is stable. The median price is unchanged from last year, at $995,000, while the average dipped just 3% to $1,294,316. This is positive news for homeowners who may be concerned that rising mortgage rates and market volatility, coupled with fewer buyers, could negatively impact home values. There is still enough demand in the market to meet the supply and keep pricing stable. It is unlikely there will be any major price correction in the near term.
Homes are also selling in just 104 days on average, the quickest pace since 2015 when they averaged 88 days listed. The time properties took to sell peaked in 2020 when homes spend an average of 143 days listed. Prior to 2020, it took the longest for properties to sell in 2010, coming out of the recession and housing collapse, at 206 days.
